ShmoopTube
Where Monty Python meets your 10th grade teacher.
Search Thousands of Shmoop Videos
Playlist CAHSEE Math Test Prep: Statistics, Data, and Probability II 30 videos
CAHSEE Math Statistics, Data, and Probability II: Drill 1 Problem 1. Which of the following tables best represents the relationship between the val...
Statistics, Data, and Probability II Drill 1, Problem 2. Based on the chart, which of the following statements is true?
CAHSEE Math Statistics, Data, and Probability II: Drill Set 1, Problem 3. Based on the following, which of the following statements is true?
CAHSEE Math 4.4 Statistics, Data, and Probability II 174 Views
Share It!
Description:
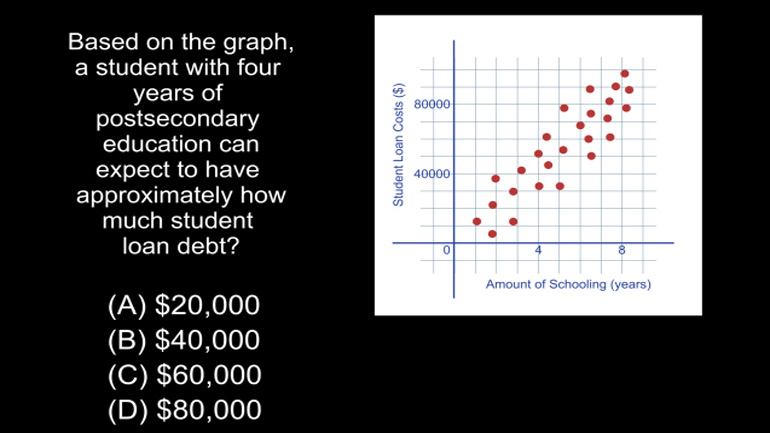
Statistics, Data, and Probability II Drill 4 Problem 4. Based on the graph, a student with four years of postsecondary education can expect to have approximately how much student loan debt?
Transcript
- 00:03
Shmoop-oop-a-doop-boop… boop-boop!
- 00:09
You might want to turn on all the lights and grab a friend for this one…
- 00:12
hang on for a truly terrifying question…
- 00:15
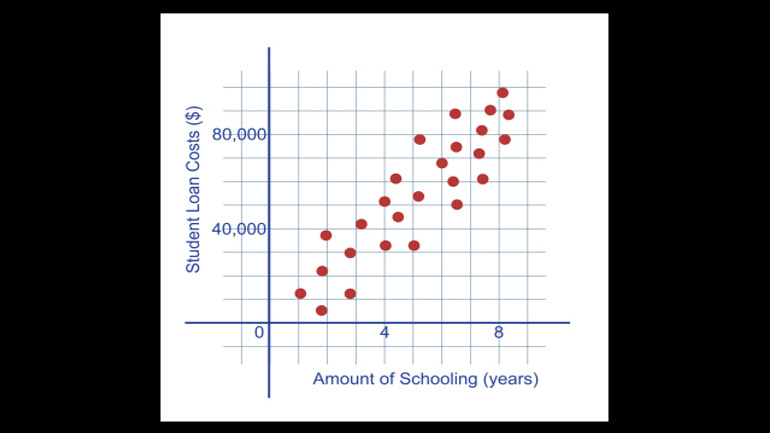
The following plot shows the relationship between the amount of postsecondary education
- 00:19
and the amount of student loan debt for several students.
Full Transcript
- 00:23
Based on the graph, a student with four years
- 00:25
of postsecondary education can expect to have approximately how much student loan debt?
- 00:30
And here are the potential answers...
- 00:39
This question is all about… simply reading a graph – or at least a pimply set of dots.
- 00:44
If you go over to 4 on the x-axis and then crawl upwards so you’re in the middle of
- 00:49
where most of those dots hover, you get to about $40,000.
- 00:53
The BEST answer definitely ISN'T 20, 60 or 80 grand… so 40 has to be the right answer.
- 01:00
And it is. B's our guy.
- 01:02
Of course, the numbers in this chart are merely for the purposes of the problem at hand.
- 01:06
In reality… be prepared to spend $40,000 on textbooks…
- 01:10
Or instead, go and see the kindly, loving people at Chegg!
Related Videos
Statistics, Data, and Probability II Drill 3 Problem 2. Which two sports together make up for the preferences of more than half of all those w...
Statistics, Data, and Probability II Drill 3 Problem 3. One hundred twenty of those who were asked preferred what sport?
CAHSEE Math: Algebra and Functions Drill 5, Problem 3. Solve the equation.
Statistics, Data, and Probability I: Drill Set 3, Problem 4. How many different avatars can be created based on the given options?


