ShmoopTube
Where Monty Python meets your 10th grade teacher.
Search Thousands of Shmoop Videos
Statistics and Probability Videos 134 videos
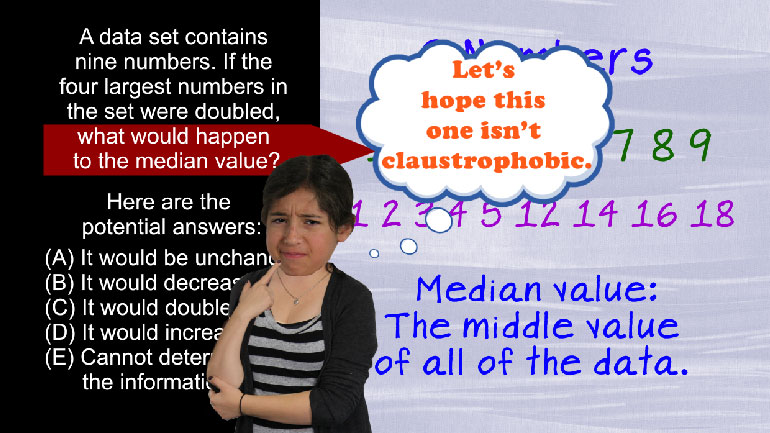
SAT Math: Statistics and Probability Drill 1, Problem 2. If the four largest numbers in the set were doubled, what would happen to the median...
SAT Math 1.4 Statistics and Probability. If two standard 6-sided dice are rolled, what is the probability that the sum of the dice will be gre...
SAT Math 1.5 Statistics and Probability. If Silas draws one card, then places it in his pocket and draws another, what is the probability that...
CAHSEE Math 4.5 Mathematical Reasoning 181 Views
Share It!
Description:
Mathematical Reasoning Drill 4 Problem 5. With each Pea paying $2.25, how many miles did the taxi drive during the ride?
Transcript
- 00:03
If at first you don’t succeed, shmoop, shmoop again…
- 00:08
The four Black Eyed Peas are late for a gig.
- 00:11
They’re determined to have a good good night,
- 00:13
so they decide to grab a taxi in order to make it to the venue on time.
- 00:16
The following graph shows the relationship between the cost of a taxi ride and the number
Full Transcript
- 00:20
of miles driven by the taxi to its destination.
- 00:23
With each Pea paying $2.25, how many miles did the taxi drive during the ride?
- 00:29
And here are the potential answers…
- 00:35
To solve this question, we need to take two steps.
- 00:37
First, we need to figure out how much money the four Peas paid in total.
- 00:41
Then, we can plug that in as the total cost of the ride to figure out how far the taxi took them.
- 00:46
There were four people, and each paid $2.25…
- 00:50
…so we can multiply 4 by $2.25 to get that, in total, they paid $9.
- 00:56
Must be a celebrity rate. So now, all we have to do is find where $9
- 01:00
is on the y-axis and then find the corresponding x-value.
- 01:04
But looking at the graph, there isn’t a nine…
- 01:06
That’s okay, though… we can figure out where nine is using the points we do know.
- 01:11
Every two lines we see an increase of four, which means that each line marks an increase of two.
- 01:18
This means that halfway from one line to the next is 1.
- 01:22
We want to find where on the y-axis we get nine, which is one more than eight.
- 01:26
This means we need to go halfway between eight and the line above it. That’s right here.
- 01:31
Now we have to figure out the scale on the x-axis.
- 01:34
Every four lines, the distance goes up by eight miles.
- 01:38
Dividing by four, we can find that each line marks an increase of two miles.
- 01:43
The vertical line we care about is just before sixteen, which is fourteen.
- 01:47
So, our answer is (C).
- 01:49
As in, “Celebrity rate.”
Related Videos
CAHSEE Math: Algebra and Functions Drill 5, Problem 3. Solve the equation.
The video will show you how to plot points in 3D using the axes of the 3D coordinate system. Make sure you're wearing your special glasses for this...
When graphing inequalities, you graph the line, shade the corresponding side, and plug in the point. The end!
One formula to rule them all, one formula to find them. One formula to bring them all, and in the darkness bind them. Or something like that. I...
