ShmoopTube
Where Monty Python meets your 10th grade teacher.
Search Thousands of Shmoop Videos
Exploring Data Videos 25 videos
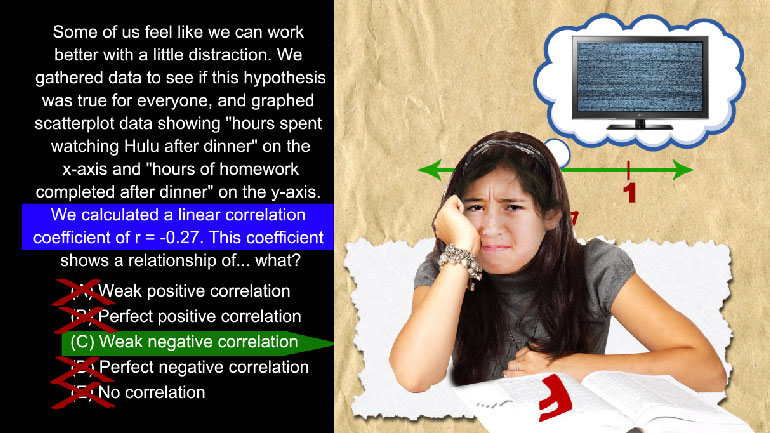
AP Statistics: Exploring Data Drill 1, Problem 2. Which of the following is the best way to display this type of data?
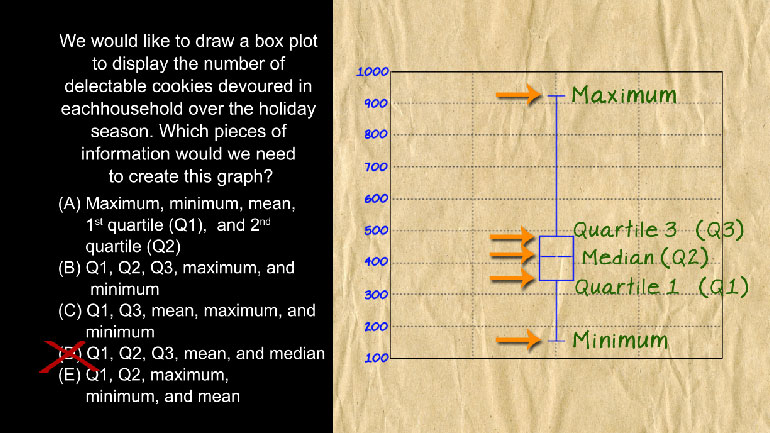
AP Statistics: Exploring Data Drill 1, Problem 5. Which pieces of information would we need to create this graph?
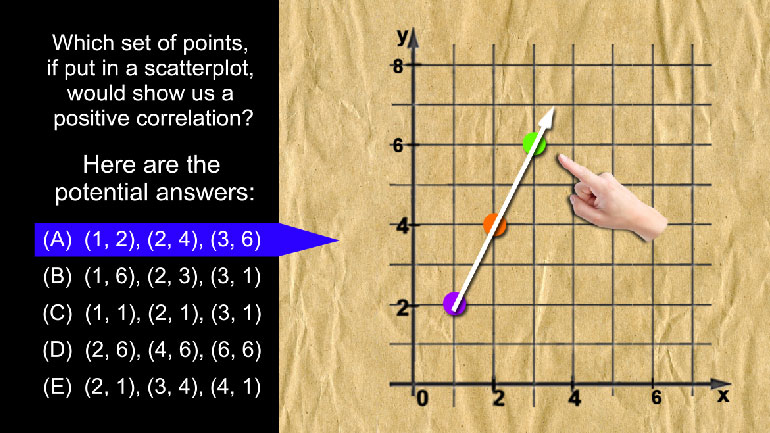
AP Statistics: Exploring Data Drill 2, Problem 3. Which set of points, if put in a scatterplot, would show us a positive correlation?
AP Statistics 1.5 Exploring Data 211 Views
Share It!
Description:
AP Statistics: Exploring Data Drill 1, Problem 5. Which pieces of information would we need to create this graph?
Transcript
- 00:03
Here's your shmoop du jour, brought to you by Cookies.
- 00:06
Because even a web browser has a sweet tooth.
- 00:10
We would like to draw a box plot to display the number of delectable cookies
- 00:14
devoured in each household over the holiday season.
- 00:18
Which pieces of information would we need to create this graph?
Full Transcript
- 00:21
And here are the potential answers...
- 00:26
It's asking us what pieces of information we need to make a box plot.
- 00:30
So we're talking about something that looks like this:
- 00:33
Now let's take a gander at what makes up this plot.
- 00:36
The minimum and maximum, to start. Well, all of our answers except D have the max and min.
- 00:42
So we can eliminate D. The box in between the min and max is made
- 00:45
up of quartile 1 and quartile 3, with the middle line being the median, or Q2.
- 00:52
Quartile 1 stands for the middle number between the minimum and the median.
- 00:57
Quartile 3 is the middle number between the median and the maximum.
- 01:01
The only answer choice that contains all of these... is B.
Related Videos
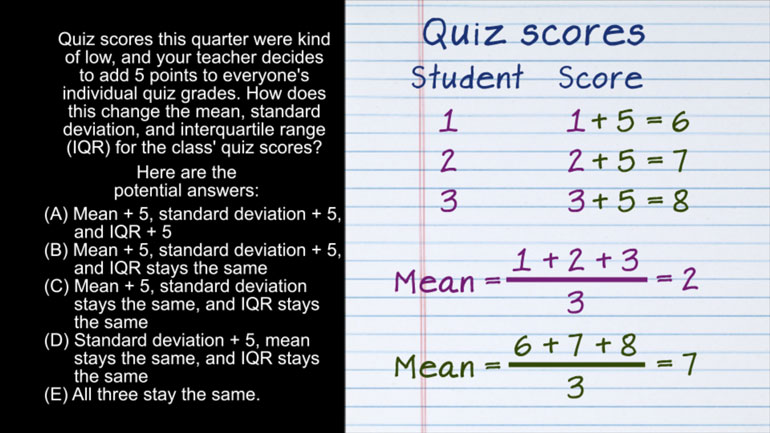
AP Statistics 2.1 Exploring Data. How does this change affect the mean, standard deviation, and IQR?
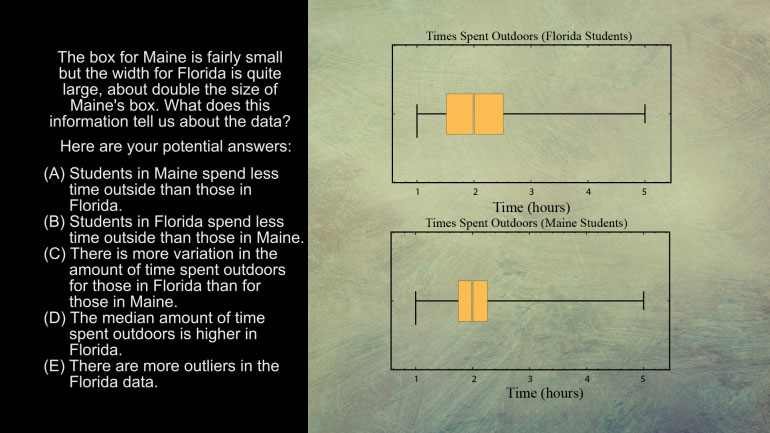
AP Statistics 5.1 Exploring Data. What does this information tell us about the data?
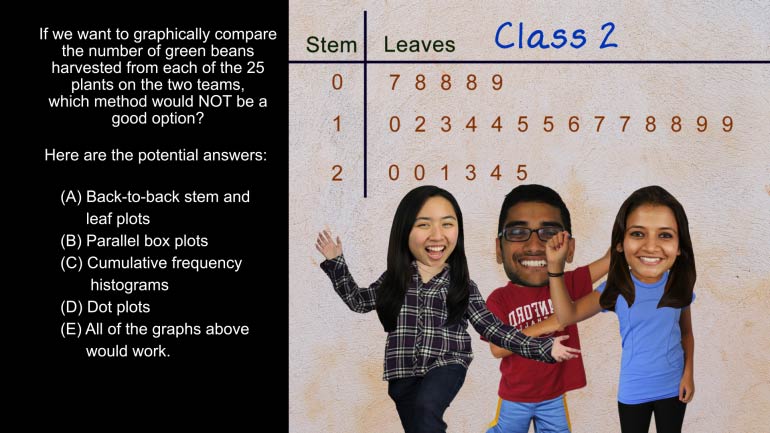
AP Statistics 5.2 Exploring Data. Which method would not be a good option?
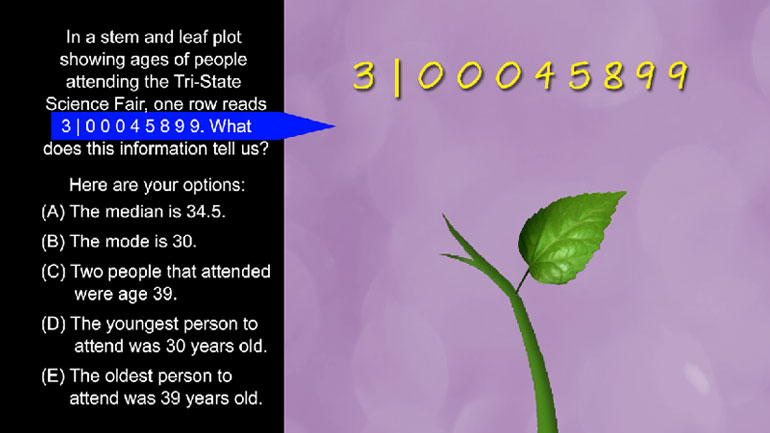
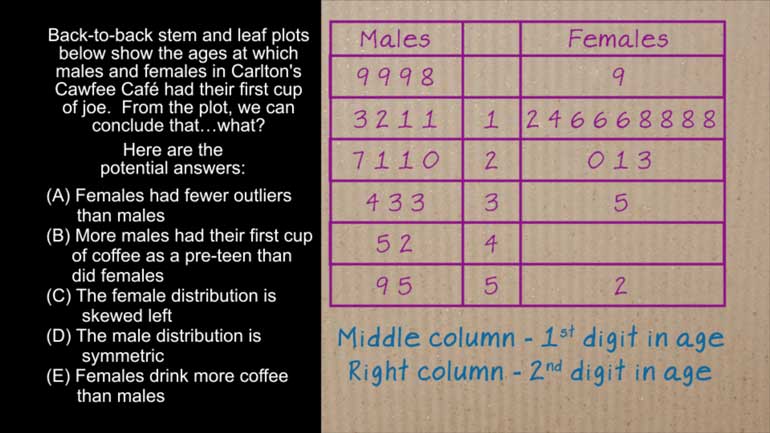
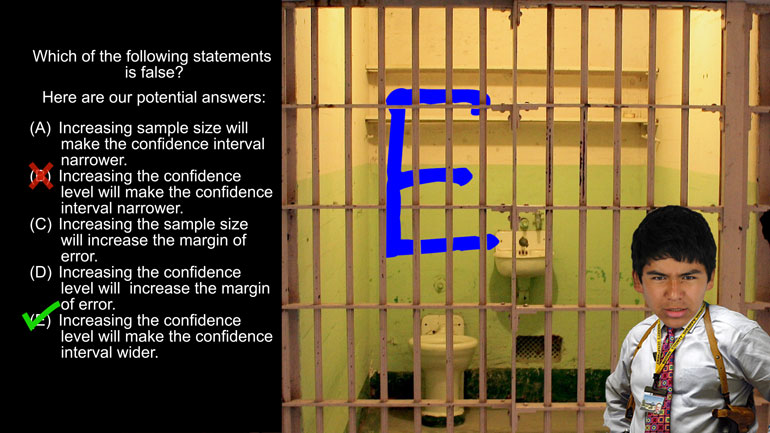
AP Statistics 1.5 Statistical Inference. Which of the following statements is false?
Want to pull an Oliver Twist and ask us for more? We've gotcha covered. Head over to /video/subjects/math/test-prep/ap-statistics/ for more AP...

