ShmoopTube
Where Monty Python meets your 10th grade teacher.
Search Thousands of Shmoop Videos
Exploring Data Videos 25 videos
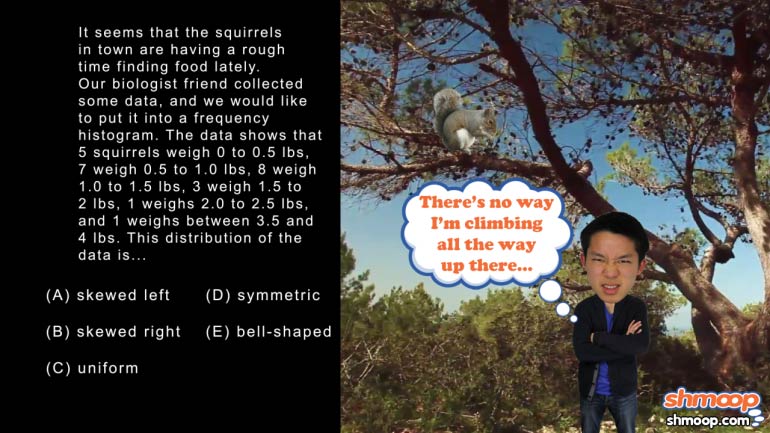
AP Statistics: Exploring Data Drill 1, Problem 2. Which of the following is the best way to display this type of data?
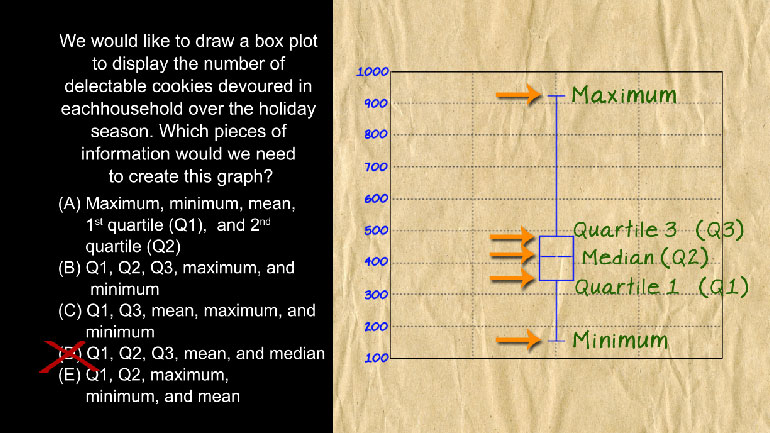
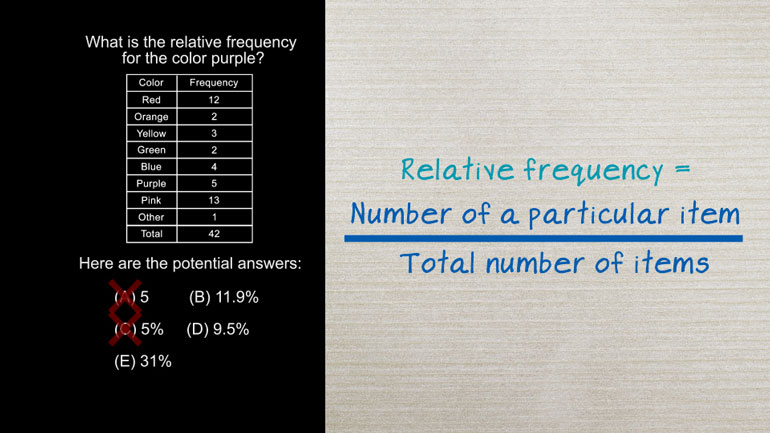
AP Statistics: Exploring Data Drill 1, Problem 5. Which pieces of information would we need to create this graph?
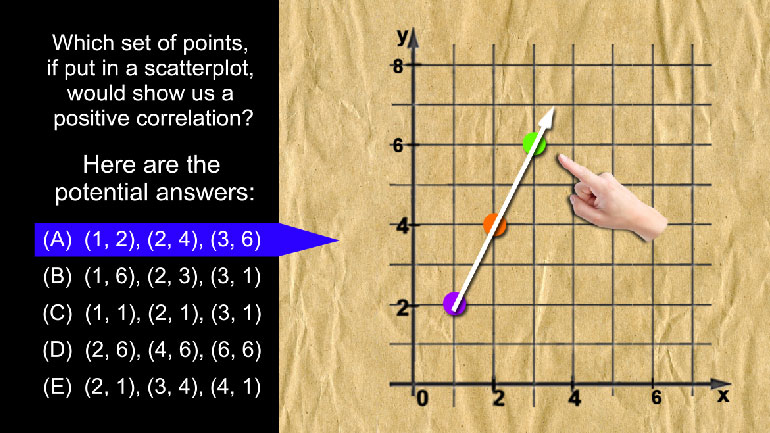
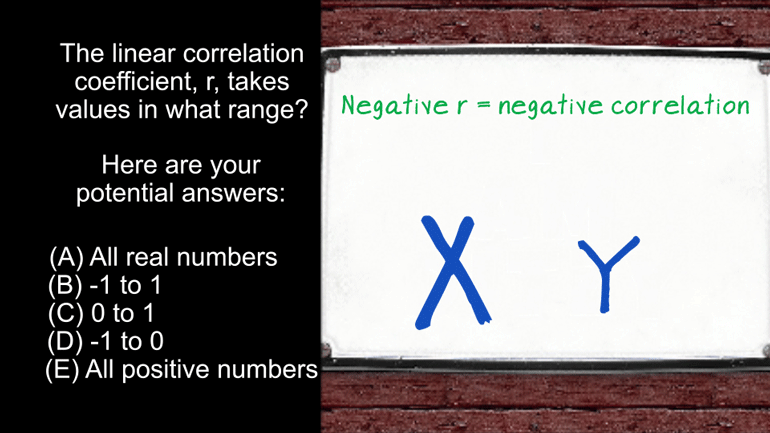
AP Statistics: Exploring Data Drill 2, Problem 3. Which set of points, if put in a scatterplot, would show us a positive correlation?
AP Statistics 5.3 Exploring Data 173 Views
Share It!
Description:
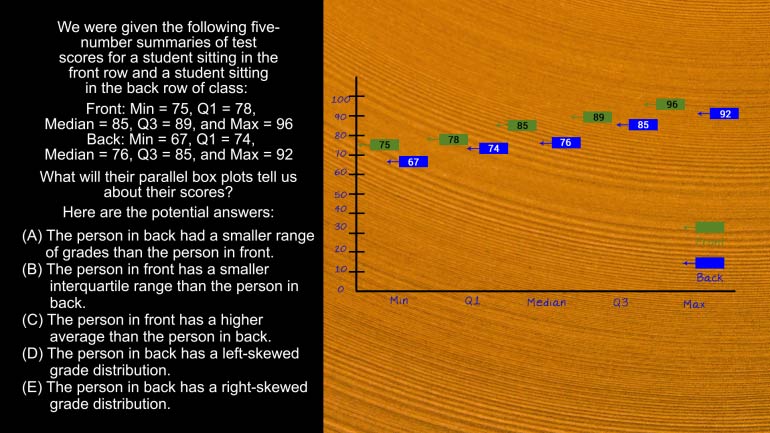
AP Statistics 5.3 Exploring Data. What will their parallel box plots tell us about their scores?
Transcript
- 00:00
Thank you We sneak and here's your shmoop you sure
- 00:05
brought to you by the back row talking about you
- 00:07
guys Yeah the preferred row of loners and members of
- 00:11
the mob We were given the following five number summaries
- 00:14
of test scores for a student sitting in the front
Full Transcript
- 00:16
row and a student sitting in the back row of
- 00:18
class what will their parallel box plots tell us about
- 00:21
their scores Question People have been asking for ages please
- 00:26
for five minutes and hear the potential answers No All
- 00:32
right well it was the closest of students It was
- 00:35
the furthest away of students So we've got one kid
- 00:40
in the back row and one in the front were
- 00:42
given their lowest and the highest test scores plus the
- 00:45
median first and third corps tiles of each were being
- 00:49
asked about this data being shown in parallel bach platform
- 00:51
So let's See what that would look like before we
- 00:54
go any further Uh pretty would be even prettier if
- 00:57
we stuck a couple of bows on him Yeah they're
- 01:00
adorable Okay so let's found this one out Could the
- 01:03
box plus be telling us that a the person in
- 01:05
back had a smaller range of grades in the person
- 01:07
in front Well let's do some math only So bomb
- 01:10
This is a math problem After all the fellow in
- 01:13
front has a range of scores from seventy five to
- 01:15
ninety six which is a difference of twenty one While
- 01:17
the kidney back has a range from sixty seven in
- 01:20
ninety two difference of twenty five it was just the
- 01:23
opposite Mr back row has a larger range of grades
- 01:26
than his front row counterpart to uncross a off list
- 01:31
And we conclude that the person in front has a
- 01:33
smaller inter quartile range than the person in back no
- 01:37
more man Serious front row guys into court tell ranges
- 01:41
from seventy eight to eighty nine which is a difference
- 01:43
of eleven But same deal for back Rogue i eighty
- 01:47
five months Seventy four is also eleven So no option
- 01:50
being is the moon Do we know that See the
- 01:54
person in front has a higher average than the person
- 01:56
in back We don't have all the data points here
- 01:59
Just a few select one So so there's no way
- 02:00
to calculate the average Although we're gonna be boldly suggest
- 02:03
that neither of them is going to find the cure
- 02:05
cancer Well then it has to be one of the
- 02:07
last two Even a person and back has a left
- 02:09
or right skewed distribution Well which is it to figure
- 02:13
that out We always have to look at the median
- 02:15
when the media is very close to the first court
- 02:17
tile The distribution is skewed right When it's close to
- 02:20
the third quarter mile the distribution is skewed Left in
- 02:23
this case we've got a median of seventy six and
- 02:26
the first quarter Hell is right on top of it
- 02:28
It's seventy four Oh yeah The distribution is skewed right
- 02:31
which is option e nicely done with the head of
- 02:36
the class Or well stay in the back If you'd 00:02:38.29 --> [endTime] rather it's a
Related Videos
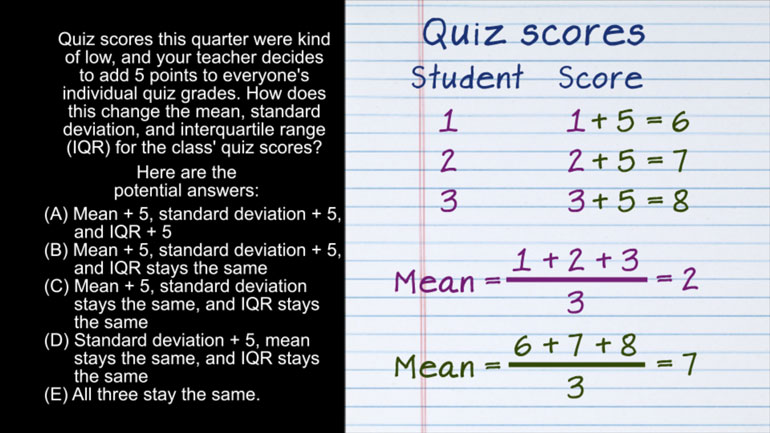
AP Statistics 2.1 Exploring Data. How does this change affect the mean, standard deviation, and IQR?
AP Statistics 5.1 Exploring Data. What does this information tell us about the data?
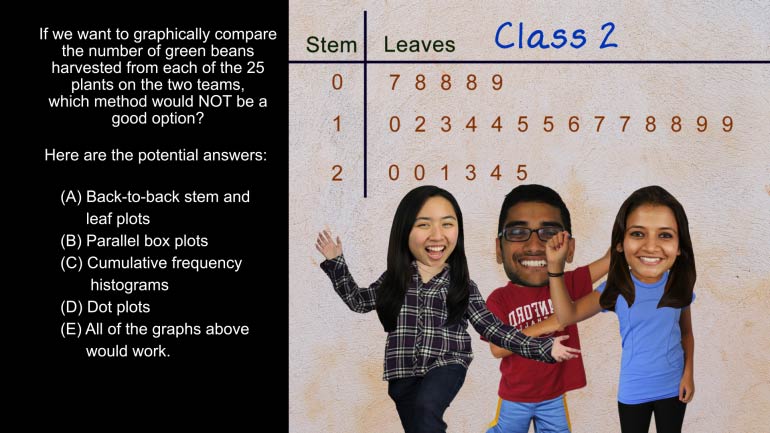
AP Statistics 5.2 Exploring Data. Which method would not be a good option?
AP Statistics 1.5 Statistical Inference. Which of the following statements is false?
Want to pull an Oliver Twist and ask us for more? We've gotcha covered. Head over to /video/subjects/math/test-prep/ap-statistics/ for more AP...

